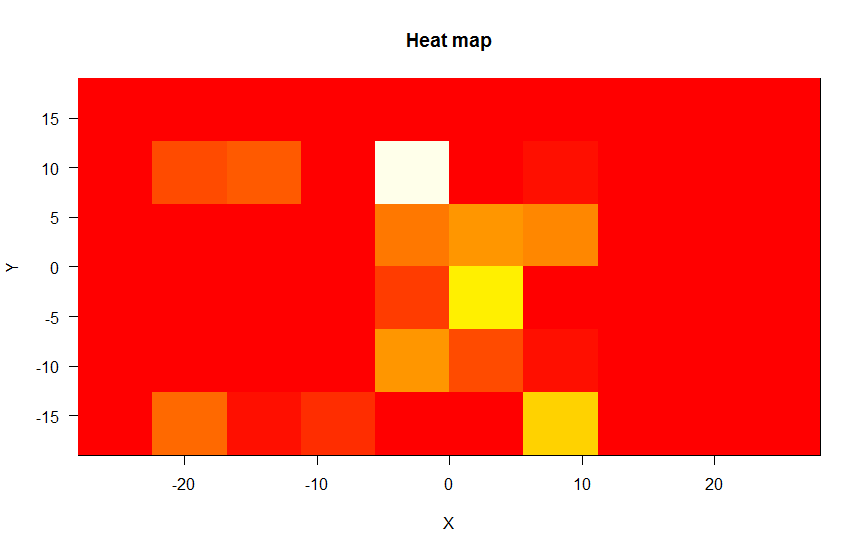
A heat map is a graphical representation of data where the individual values contained in a matrix are represented as colors. –Wikipedia
Concept
Here is my approach to deal with it. All that is need is a frequency of a value being repeated in case of one dimension and then creating a color map for high to low and plotting them on a graph. Continue reading “Generating Heat Maps for eye-tracker data”→
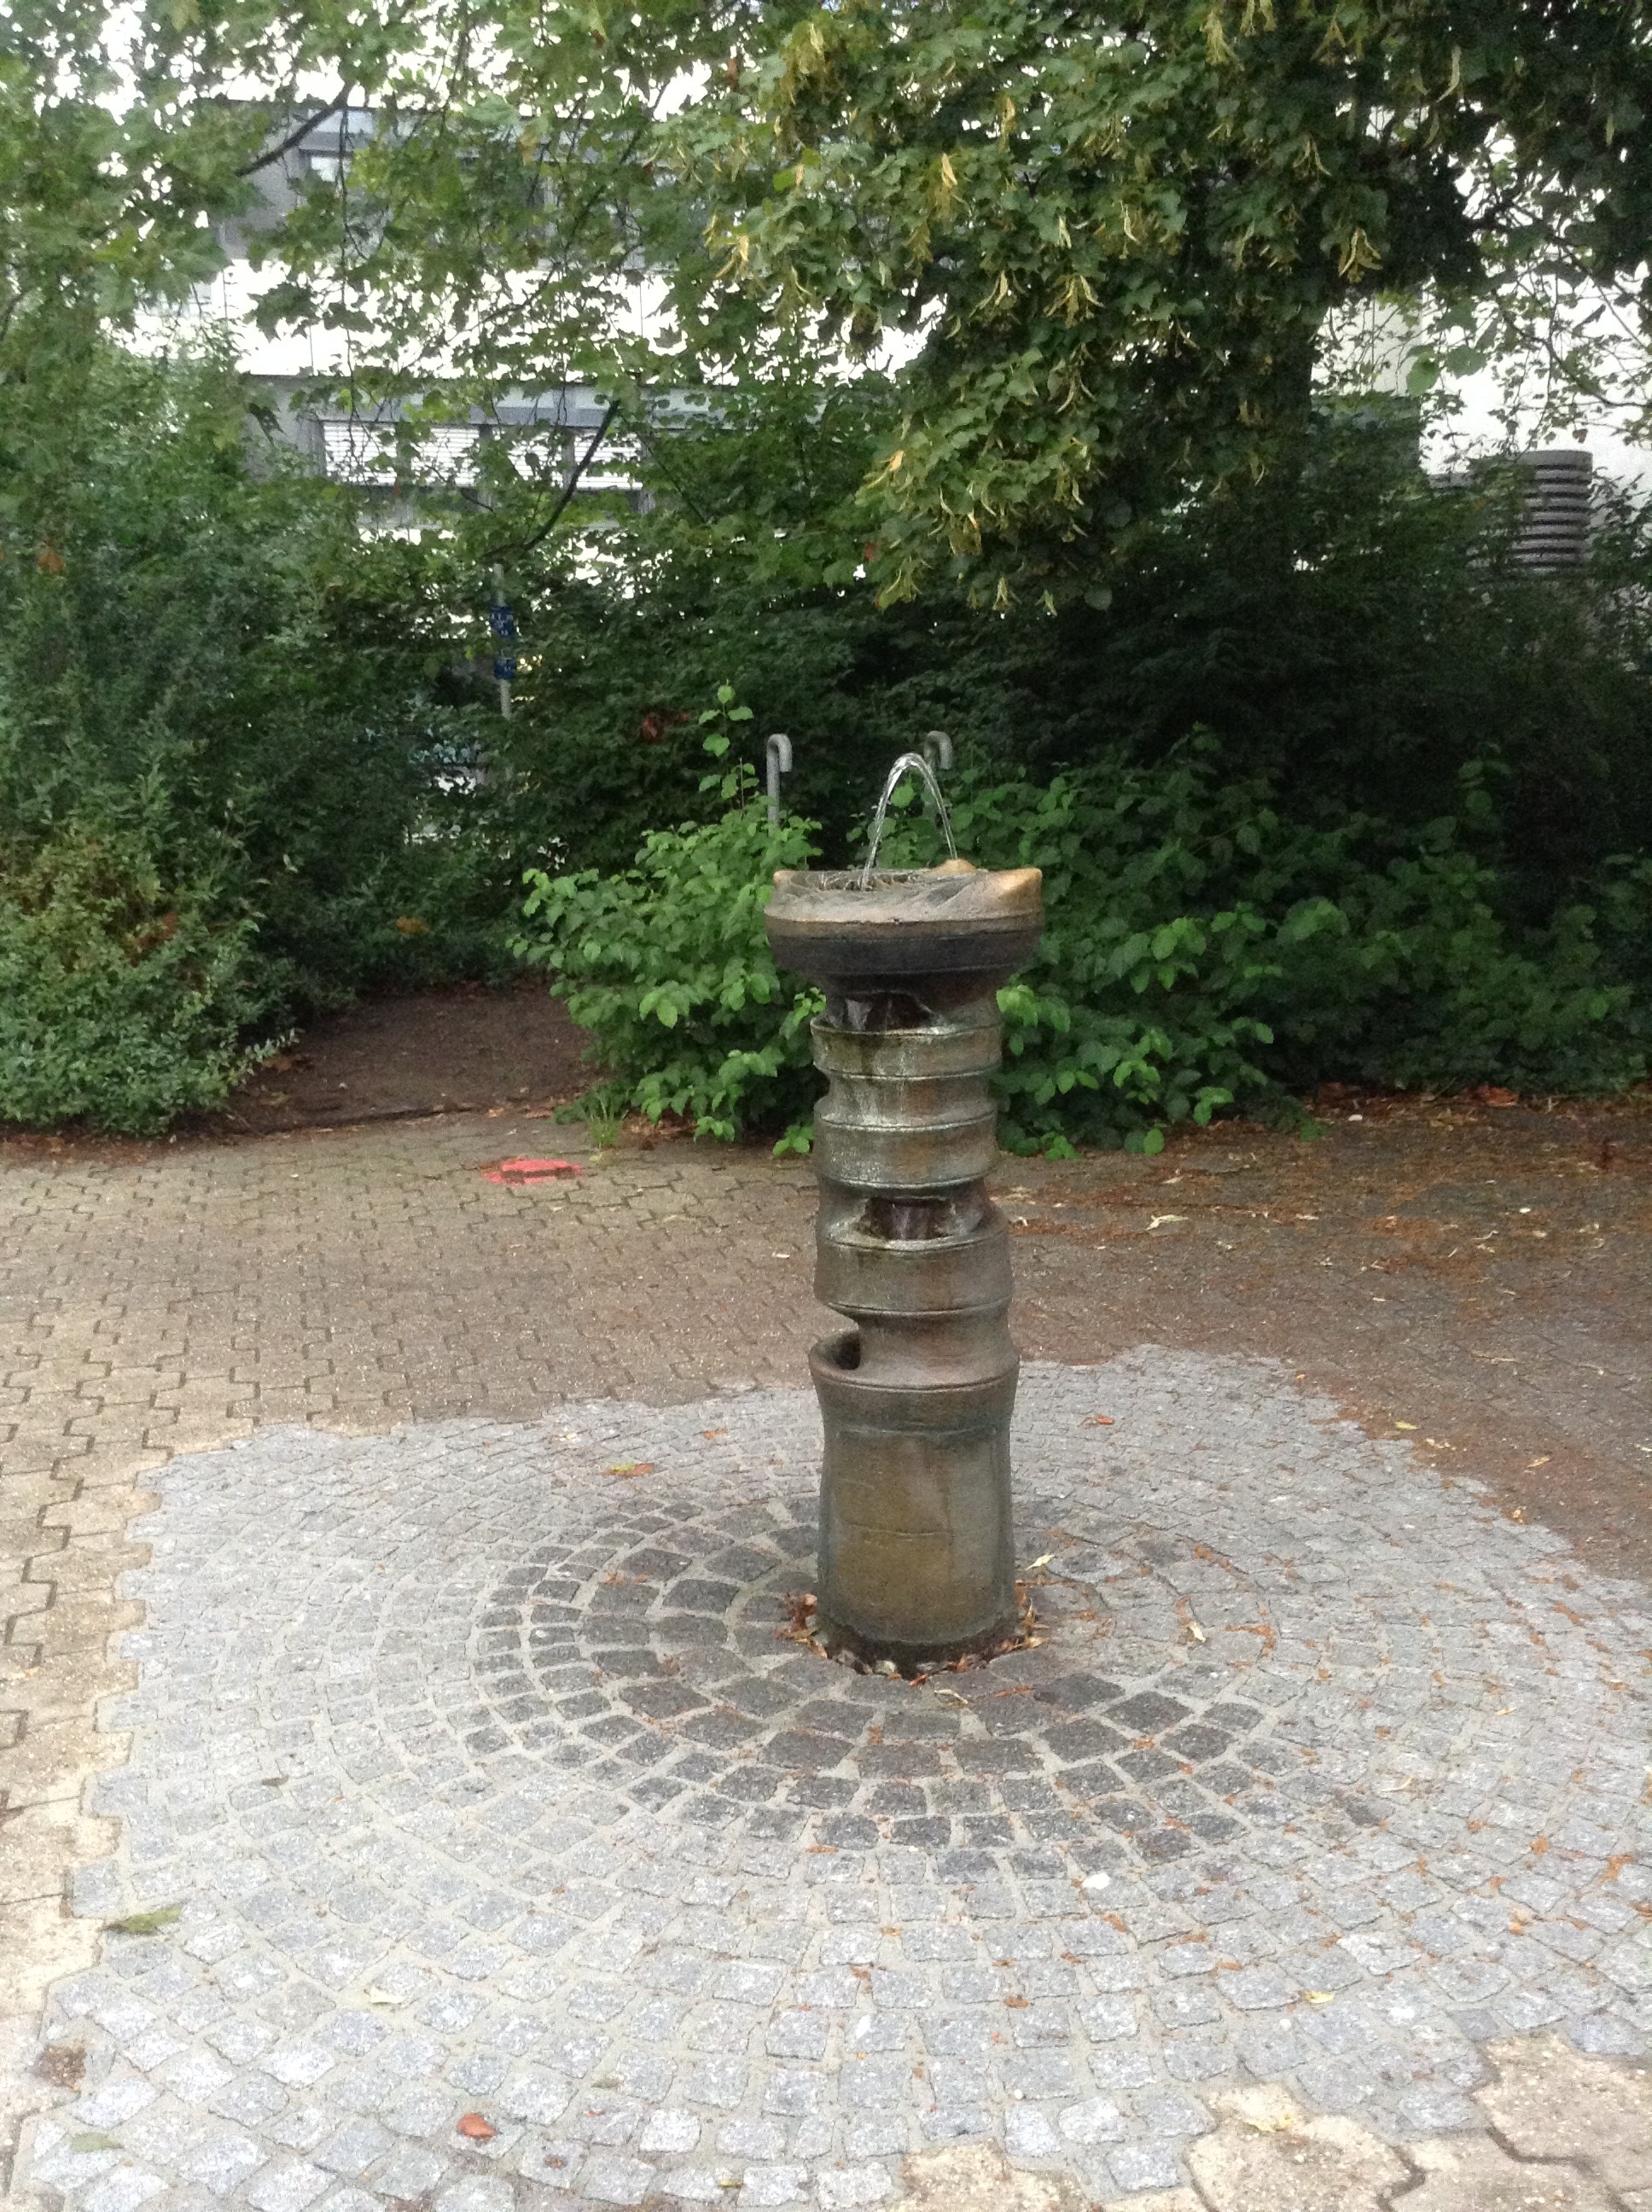
A bottle was filled in 21 seconds. Winny was the time keeper. It was a 1 litre bottle. So scientifically saying it took 21 seconds for 1000 millilitres. (Please comment if you have more accurate results to take a list of values from different trails to make the calculations more robust)
The above data was to get the facts straight and may be I would use it later. Since flow rate is assumed to be constant for 6 months which is the period the fountain is in service. I want the time to be six months since it is only on during the summer and during the winter it is going to be frozen!
Let me try to find out how much water is being pumped out during the service period in the next page.