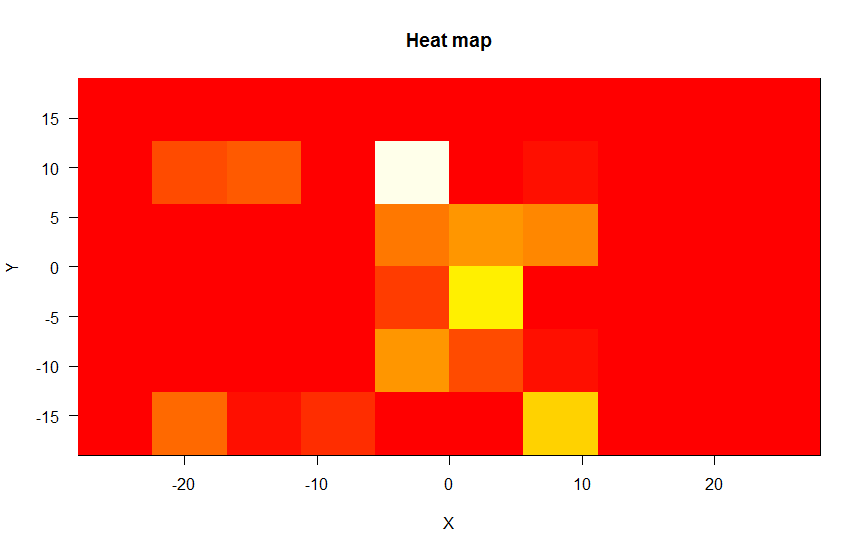
A heat map is a graphical representation of data where the individual values contained in a matrix are represented as colors. –Wikipedia
Concept
Here is my approach to deal with it. All that is need is a frequency of a value being repeated in case of one dimension and then creating a color map for high to low and plotting them on a graph. Continue reading “Generating Heat Maps for eye-tracker data”